Doodler and graphic recorder Dr. Jess Wade: “making art should be part of your lab report”

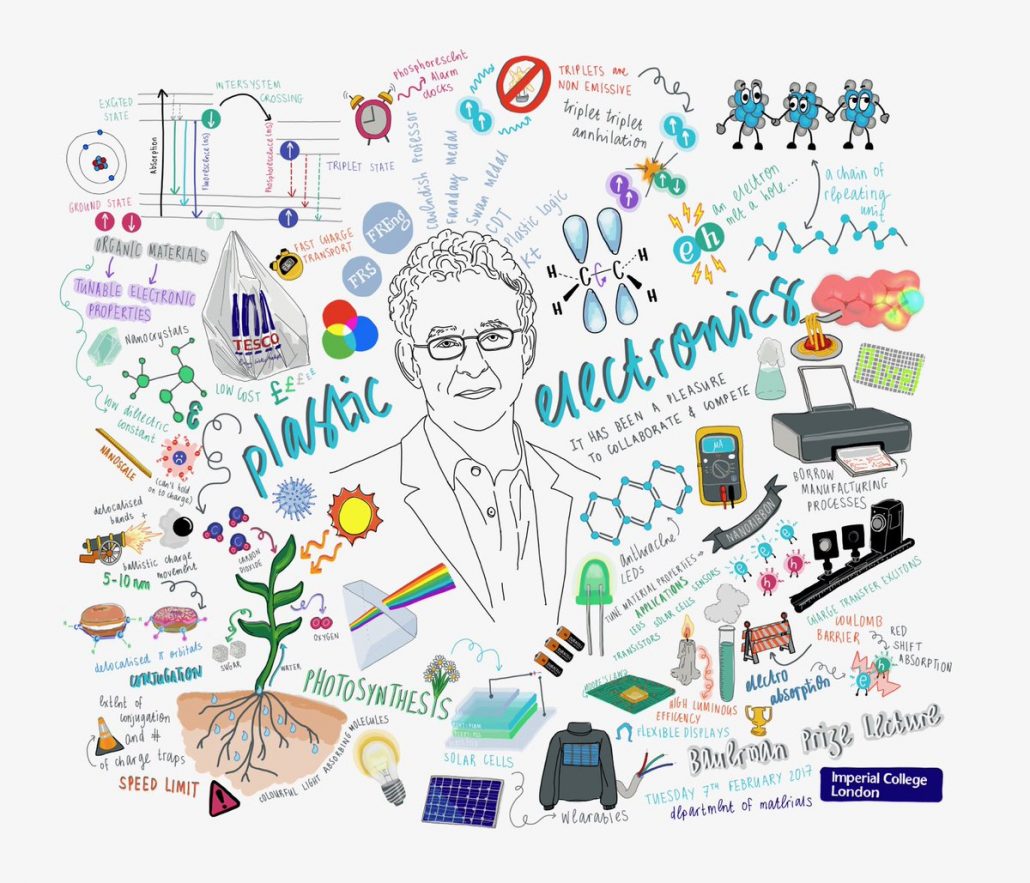
Jess Wade, postdoc in physics at Imperial Collage, has taken her personal doodling to the next level and become a graphic recorder. In this way, she can combine two of her passions – science communication and art. On Twitter, she lets the world know what lectures she has ben listening to.
We got in touch with Jess for some personal reflections and a few practical tips.
“The brain processes images 60,000 times faster than text and 93% of all human communication is visual. I don’t think I’m alone when I say I learn by creating and studying images. I have always doodled in the margins of notebooks, finding new ways to memorise complicated equations by playing with fonts and simple graphics. Ask me anything about the Spanish Habsburgs I would be silent, but I could tell you all about Margaret Theresa through my love of Velázquez. Italian history is not my forté, but the visual appeal of the Renaissance made learning about the Masters a pleasure.”
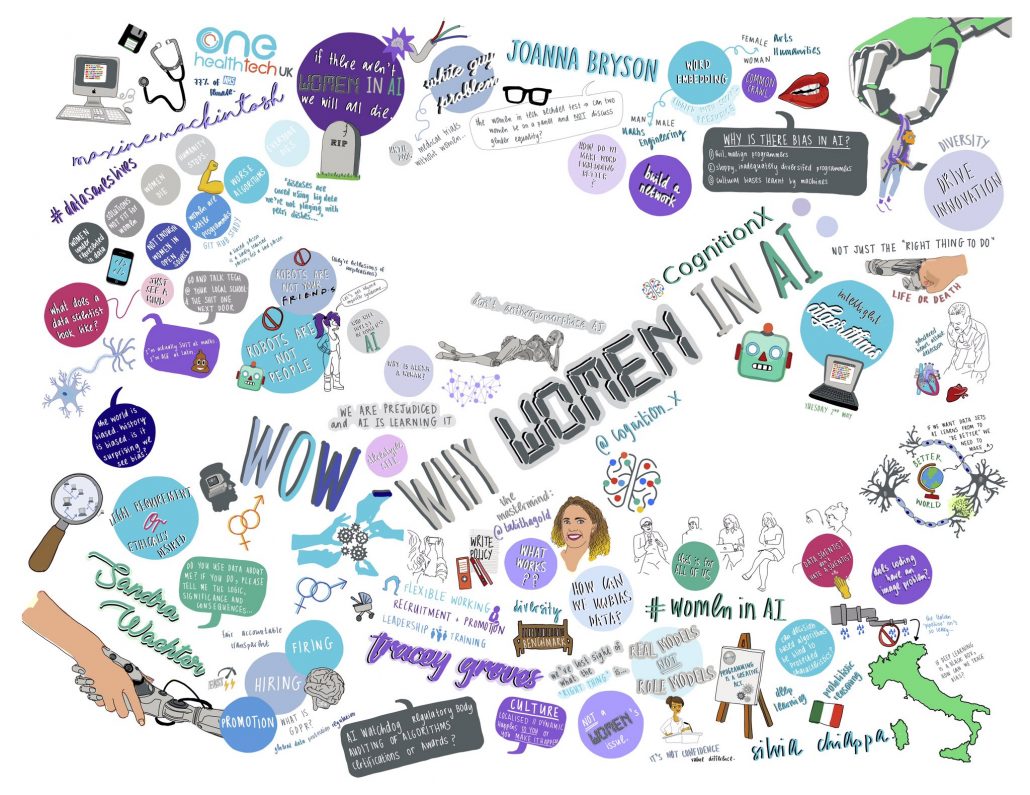
“There is something incredibly rewarding about illustrating lectures. For one, no one else in science seems to be doing it (probably too busy writing journal articles ;)), which means that you can get easily recognised. Here I am using ‘recognise’ as proxy for ‘likes on Twitter’. It helps to consolidate what you have heard, which is especially important when you are exploring a new discipline. It can personalise your interpretation before you share it with the wider world: quotations or ideas you found particularly important, and how they inspired your imagination. Most importantly, they look awesome- for Christmas this year I gave my dad a collection of all the lectures I have attended this term.”
“Here is my very amateur advice for sparking your inventiveness:
- Get an iPad Pro, and an Apple Pencil, and cherish (/charge!) it. There are a range of free apps to draw, edit and upload, and you will be amazed by how much you can achieve without carrying a pencil case or watercolour palette. It also leaves your mobile phone free for google image searches (logos, references, how to draw hands …).
- Take a course in infographics and play around on websites like Yau’s Flowing Data. I loved a one-day course with the Guardian’s “Graphic”, celebrating good visual storytelling, and didn’t love McCandless’ “data-visualisation” workshop, but find one that suits you (and your budget) …and take notes.
- Play around with fonts and writing styles. I really like writing words down and outlining them, playing with transparency and adding ‘shadows’. If I have time, I write the word on a text editor and play around with the font to see what letters look like in joined-up writing (I never learnt properly).
- Break scientific concepts down into objects that people can understand. We all grew up exploring Microsoft Office’s clipart, but now there are hundreds of Emojis locked in our iPhones and great sites like the Noun Project. Particle accelerators sound way beyond most people’s comfort zones, but long tunnels underneath France and Switzerland are much easier to imagine.
- If you see someone talk, send the speaker your illustration (and a link to a high resolution version). For the creator, doodling becomes almost therapeutic, but what you create actually means something to the people you have just listened to. After the three-part Royal Institution Christmas Lectures, I sent the presenter (Professor Saiful Islam, University of Bath) a card created using all of my pictures from his talks – a small thanks for a heroic effort.”
Jess Wade is a post doctoral researcher in the Department of Physics and Centre for Plastic Electronics at Imperial College London as well as an engaged science communicator. In addition, she is passionate about recruiting and retaining female scientists; she set up Women in Physics at Imperial and sit nationally on the WISE young women’s board.
“Like most other scientists, I am determined to understand the world around me — in particular, the interaction of molecules in thin films and how this impacts the performance of plastic electronic devices – and I am fascinated by finding new ways to communicate what I learn. Did you know, by the way, that according to a 2006 study, half of all academic papers are only read by their authors and the journal editors — and 90 % are never cited at all (L. Meho, The Rise and Rise of Citation Analysis, Physics World, 2006)”
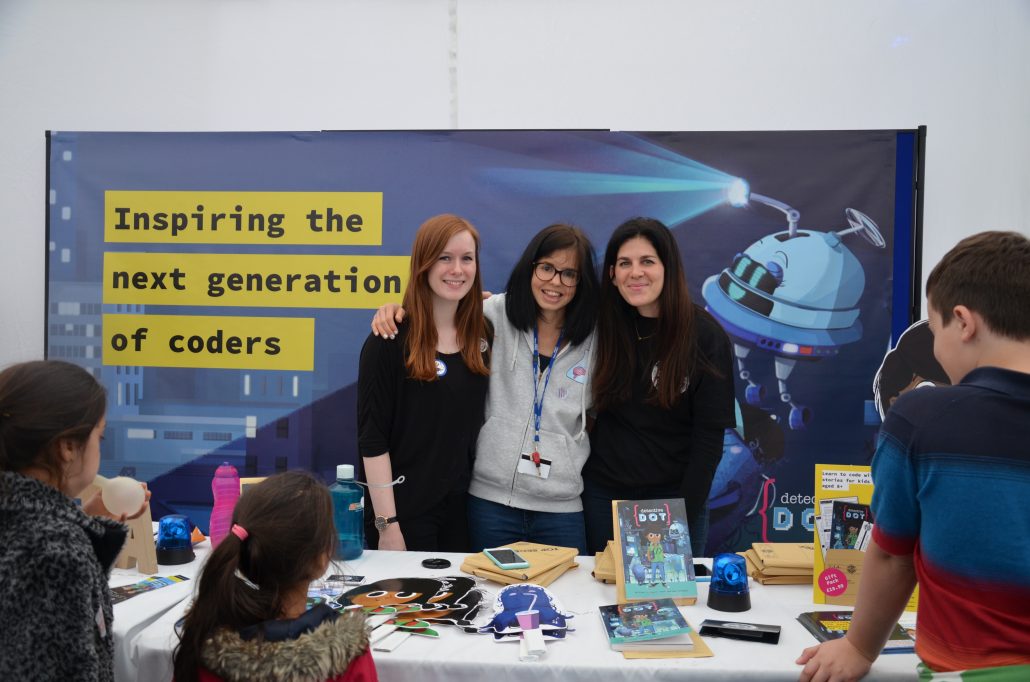
Jess (center) is a well-known profile at the UK SciComm stage.
- Claire Price of Crastina receives outreach award from Royal Society of Biology - October 25, 2020
- Agile Science student project at Brussels Engineering School ECAM: “We can’t wait to try it again!” - August 28, 2020
- Create an infographic in the Lifeology SciArt Infographic Challenge - June 16, 2020
- Adam Ruben – The scientist that teaches undergraduate students comedy - March 27, 2020
- Sam Gregson, Bad Boy of Science: “Comedy helps to bridge the gap” - March 10, 2020
- The Coolest Science Merchandise of 2019 - December 16, 2019
- Science Media Centre (UK) offers guide on dealing with online harassment in academia - November 26, 2019
- Agile project management taught to students and researchers at Karolinska Institutet - September 20, 2019
- Stefan Jansson: Improve your credibility! (Crastina Column, September 2019) - September 6, 2019
- The People’s Poet: Silke Kramprich, tech communicator - August 31, 2019


Nice post 🙂
There are more researchers / science communicators doing sketch notes / info doodling /graphic recording. These are the ones that I identify until know:
* Rob Dimeo – https://twitter.com/rob_dimeo
* Katharina Theis-Bröhl – https://twitter.com/theiskbt
* Mathis Riehle – http://bio-mat-sketches-mor.blogspot.pt/
* Jamie Lynn – https://twitter.com/weav20162
* Sue Pillans – https://twitter.com/suepillans
* Science Sketcher – https://twitter.com/ScienceSketcher
* Rita Caré – myself… I’m just beginning at: https://papirografico.wordpress.com – Check my graphic recording “Fish, they also need friends” on my blog.
Do you know more researchers / science communicators doing graphic recording? If so, please let me know for rita.s.care[@]gmail.com or @ritacarepapiro on twitter.
Thank you in advance!
Thanks Rita for the links! I’ll engage our network to see if we can help you build your list.