Posts
 https://crastina.se/wp-content/uploads/2016/08/Rgraphs_susanjohnston.jpg
1228
1648
Susan E. Johnston
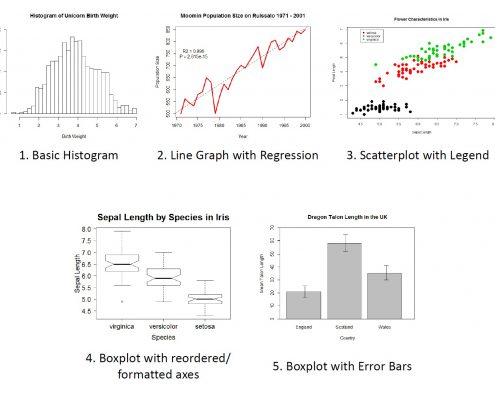
Susan E. Johnston2016-08-09 10:58:132016-09-08 23:12:46Base Graphics in R: A Detailed Idiot’s Guide
https://crastina.se/wp-content/uploads/2016/08/Rgraphs_susanjohnston.jpg
1228
1648
Susan E. Johnston
Susan E. Johnston2016-08-09 10:58:132016-09-08 23:12:46Base Graphics in R: A Detailed Idiot’s Guide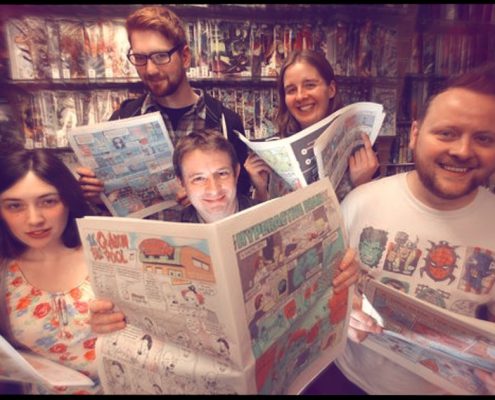 https://crastina.se/wp-content/uploads/2016/07/science_comics.jpg
631
845
Julia Turan
Julia Turan2016-07-12 19:18:522016-08-20 21:14:49Lydia Wysocki on science comics as art-science collaborations
https://crastina.se/wp-content/uploads/2016/07/science_comics.jpg
631
845
Julia Turan
Julia Turan2016-07-12 19:18:522016-08-20 21:14:49Lydia Wysocki on science comics as art-science collaborations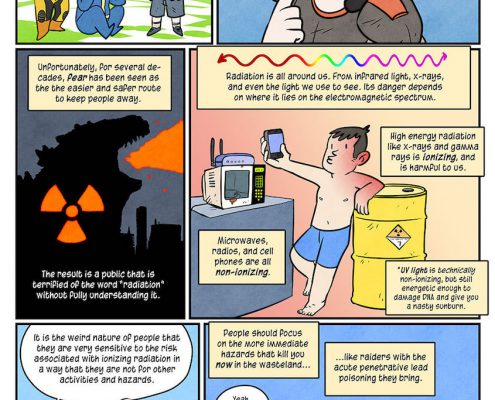 https://crastina.se/wp-content/uploads/2016/06/maki_naro_featured.jpg
684
845
Yasinee Rotratsirikun
Yasinee Rotratsirikun2016-06-15 05:41:362016-09-08 23:12:00Science Storytelling with Comics, an Interview with Maki Naro
https://crastina.se/wp-content/uploads/2016/06/maki_naro_featured.jpg
684
845
Yasinee Rotratsirikun
Yasinee Rotratsirikun2016-06-15 05:41:362016-09-08 23:12:00Science Storytelling with Comics, an Interview with Maki Naro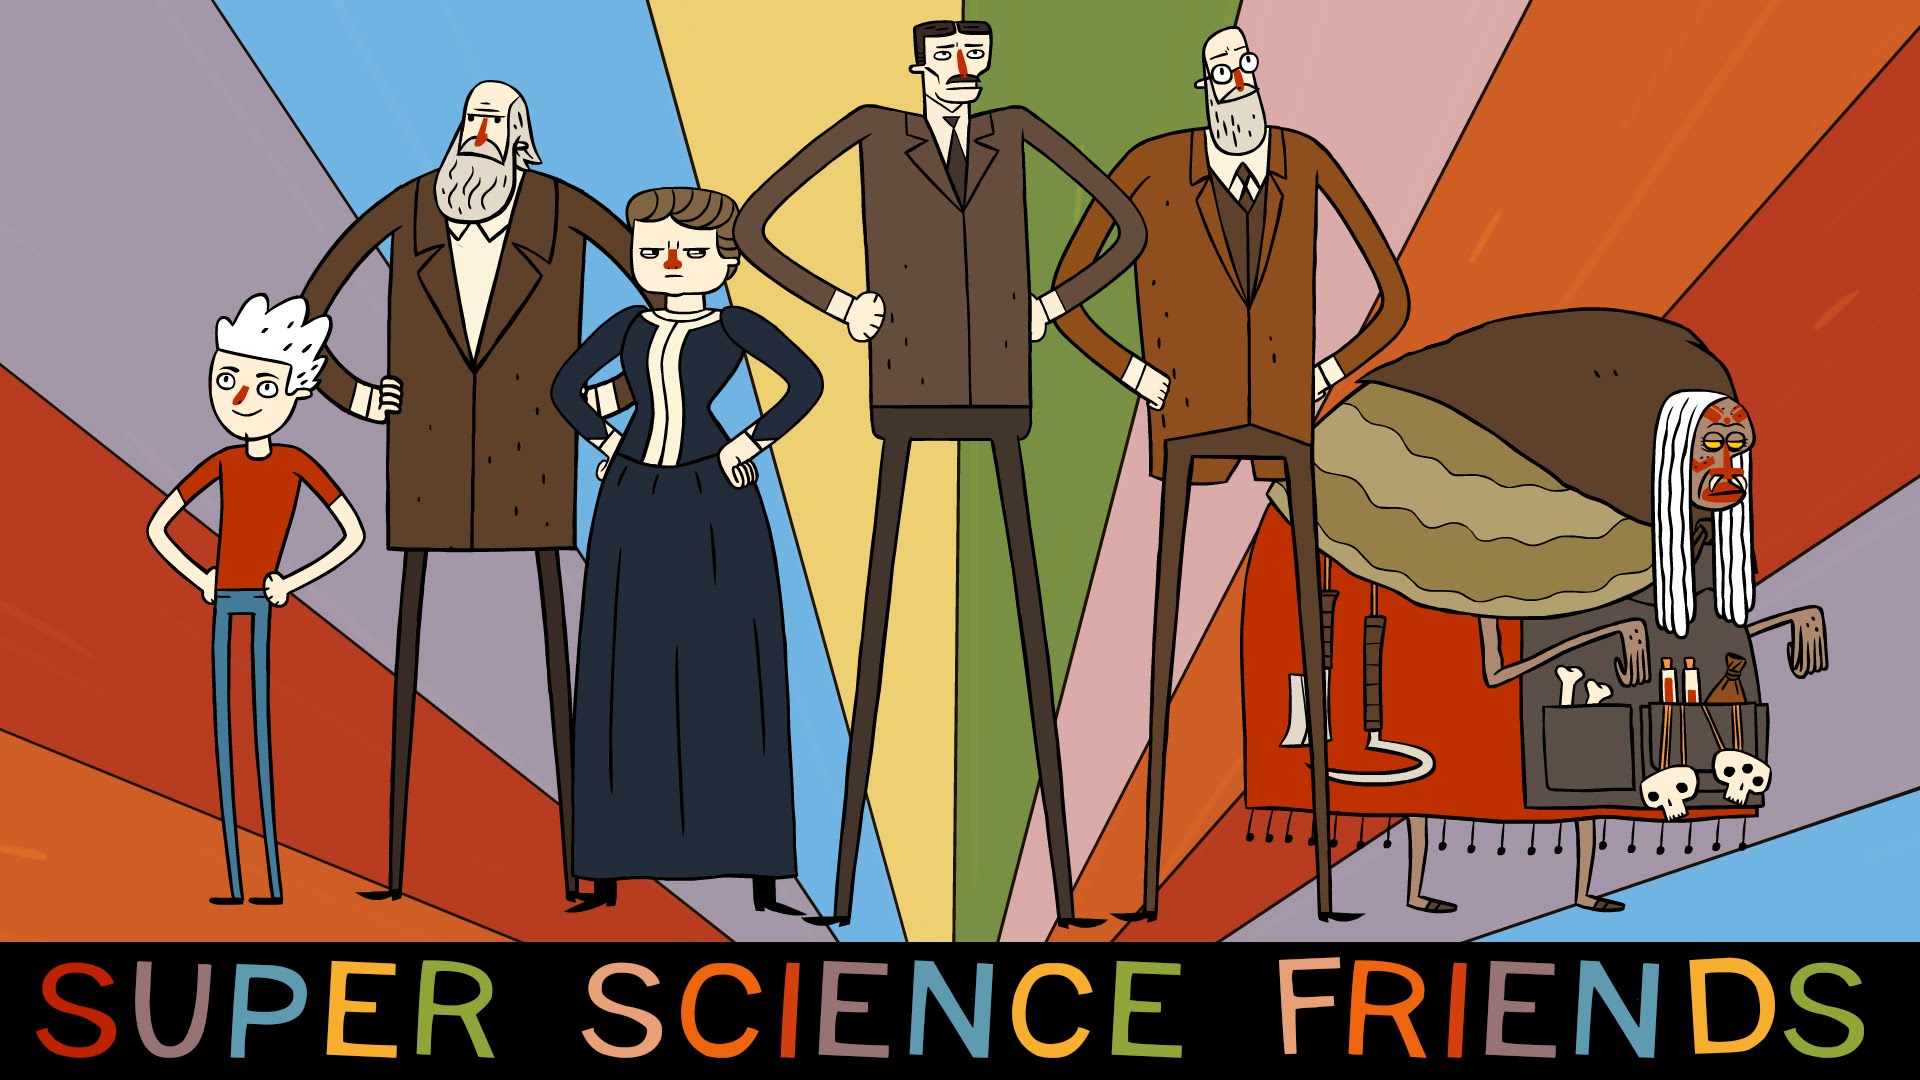 https://crastina.se/wp-content/uploads/2016/06/maxresdefault.jpg
1080
1920
Anna Woolman
Anna Woolman2016-06-06 09:57:442017-06-06 16:49:37A guide to 7 science comics and animations that you need to know about
https://crastina.se/wp-content/uploads/2016/06/maxresdefault.jpg
1080
1920
Anna Woolman
Anna Woolman2016-06-06 09:57:442017-06-06 16:49:37A guide to 7 science comics and animations that you need to know about https://crastina.se/wp-content/uploads/2016/06/featured_matteo.png
684
845
Olle Bergman
Olle Bergman2016-06-03 13:40:452016-09-15 12:53:31Why science should experiment more with comics (Matteo Farinella, June 2016)
https://crastina.se/wp-content/uploads/2016/06/featured_matteo.png
684
845
Olle Bergman
Olle Bergman2016-06-03 13:40:452016-09-15 12:53:31Why science should experiment more with comics (Matteo Farinella, June 2016) https://crastina.se/wp-content/uploads/2016/04/Skärmavbild-2016-04-22-kl.-15.02.30.png
564
994
Olle Bergman
Olle Bergman2016-04-20 11:00:002016-07-22 17:39:12Florence Schechter, science YouTuber: “Talk about what you find interesting; that enthusiasm will shine through!”
https://crastina.se/wp-content/uploads/2016/04/Skärmavbild-2016-04-22-kl.-15.02.30.png
564
994
Olle Bergman
Olle Bergman2016-04-20 11:00:002016-07-22 17:39:12Florence Schechter, science YouTuber: “Talk about what you find interesting; that enthusiasm will shine through!” https://crastina.se/wp-content/uploads/2016/04/d815a412-38a7-4bc2-8326-a47786849154.png
674
1735
Pieter Torrez
Pieter Torrez2016-04-06 13:26:242016-07-28 00:26:55How platforms like Clarafi can drastically improve your scientific visualization skills
https://crastina.se/wp-content/uploads/2016/04/d815a412-38a7-4bc2-8326-a47786849154.png
674
1735
Pieter Torrez
Pieter Torrez2016-04-06 13:26:242016-07-28 00:26:55How platforms like Clarafi can drastically improve your scientific visualization skills