The song of plankton – “visualizing” big data as music
Is there a melody in a lake? How about a song in plankton diversity? Swiss biologist and musician Simone Fontana transformed a plankton dataset from Lake Greifensee into intriguing musical imagery – with different instruments assigned to different depths.
The dynamics of aquatic ecosystems – that is what researchers from the Swiss Federal Institute of Aquatic Science and Technology Eawag are trying to understand. To do so, they have developed a high frequency monitoring station. It automatically samples, counts and measures phytoplankton, i.e. the microscopic algae living in lakes.
Big data like that are usually visualized as graphs to reveal trends and patterns. But how does plankton diversity sound like? Perhaps even stranger than the weirdest jazz you’ve ever heard.
Simone Fontana, who translated the plankton diversity data into this unusual art form, is a researcher in the field of community ecology, with a special interest in traits of individuals. He is also a rapper and an author of lyrics, and an author of two concept albums.
Crastina’s Dorota Paczesniak got in touch to find out more.
Hi Simone! How did you come up with the idea to “visualize” data as music?
During my time as PhD student I constantly discussed unconventional ideas with my supervisor Francesco Pomati. Both of us are interested in innovative ways to communicate scientific results, and it also happens that both of us are musicians.
The idea to transform the phytoplankton diversity data into music came up during one of such discussions, and then gradually developed. I presented it to another musician, environmental scientist and a friend of mine, Fabio Crivelli, who reacted enthusiastically.
Fabio owns a vintage synthesizer – it’s an instrument that can produce a variety of sounds by generating and combining different frequencies. You can play it like piano using a keyboard, but it can also be controlled by other input methods, e.g. you can program it. We took our lake plankton data and rescaled indices of change in the morphology and physiology of phytoplankton through time, so that they could be read and played by the synthesizer.
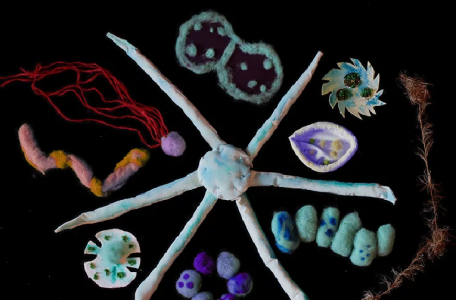
Once the music was ready we wanted a conceptual video to go with it. Riccardo Bernasconi and Francesca Reverdito from Studio Asparagus created the stop motion animation. The animated puppets represent different kinds of microalgae. Changes in their shapes and colours are also related to real phytoplankton trait diversity. We decided to create a visual story about global environmental change, and send a message about the power of youth to change things.

The automated plankton monitoring station in Lake Greifensee, Switzerland. Photo credit: Francesco Pomati, EAWAG.
What is the scope of the data that you used and how do they translate to what we hear?
As I shortly mentioned before, our main interest was to detect changes in the composition of phytoplankton communities in terms of morphological and physiological features of single cells and colonies. These changes are relevant to understand responses to environmental fluctuations and have consequences for the functioning of the whole ecosystem.
Our automatic station allowed us to measure pigment-related features of millions of cells using scanning flow cytometry, directly in the field and at very high frequency (every 4 hours). We then needed to summarize this huge amount of information, and we did so by calculating some indices which quantify the variation observed at the community levels (that is, among all individuals belonging to the same, or to different species). These indices are numbers, which can typically be plotted to visualize changes.
Since they were collected through time and at different depths, however, we decided to rescale and round them, to obtain 88 different values (corresponding to the keys of a keyboard). Time intervals between notes are regular, reflecting constant time intervals between samples (4 hours), whereas a different instrument was assigned to each different depth.
Communicating through music gives a unique opportunity to add value or a message to just plain numbers
Did “hearing” your data as music reveal something new about phytoplankton diversity to you as a scientist?
Since the data are the same we used to analyse in more classical ways (using numerical methods and graphs), music did not reveal something completely new. However, the immediacy of music is something that strikes me! Listening to our work, I realized how dramatically trait composition can change in short time. Communicating through music gives a unique opportunity to add value or a message to just plain numbers. In our case lower notes – which are generally perceived as sadder – correspond to lower biodiversity.
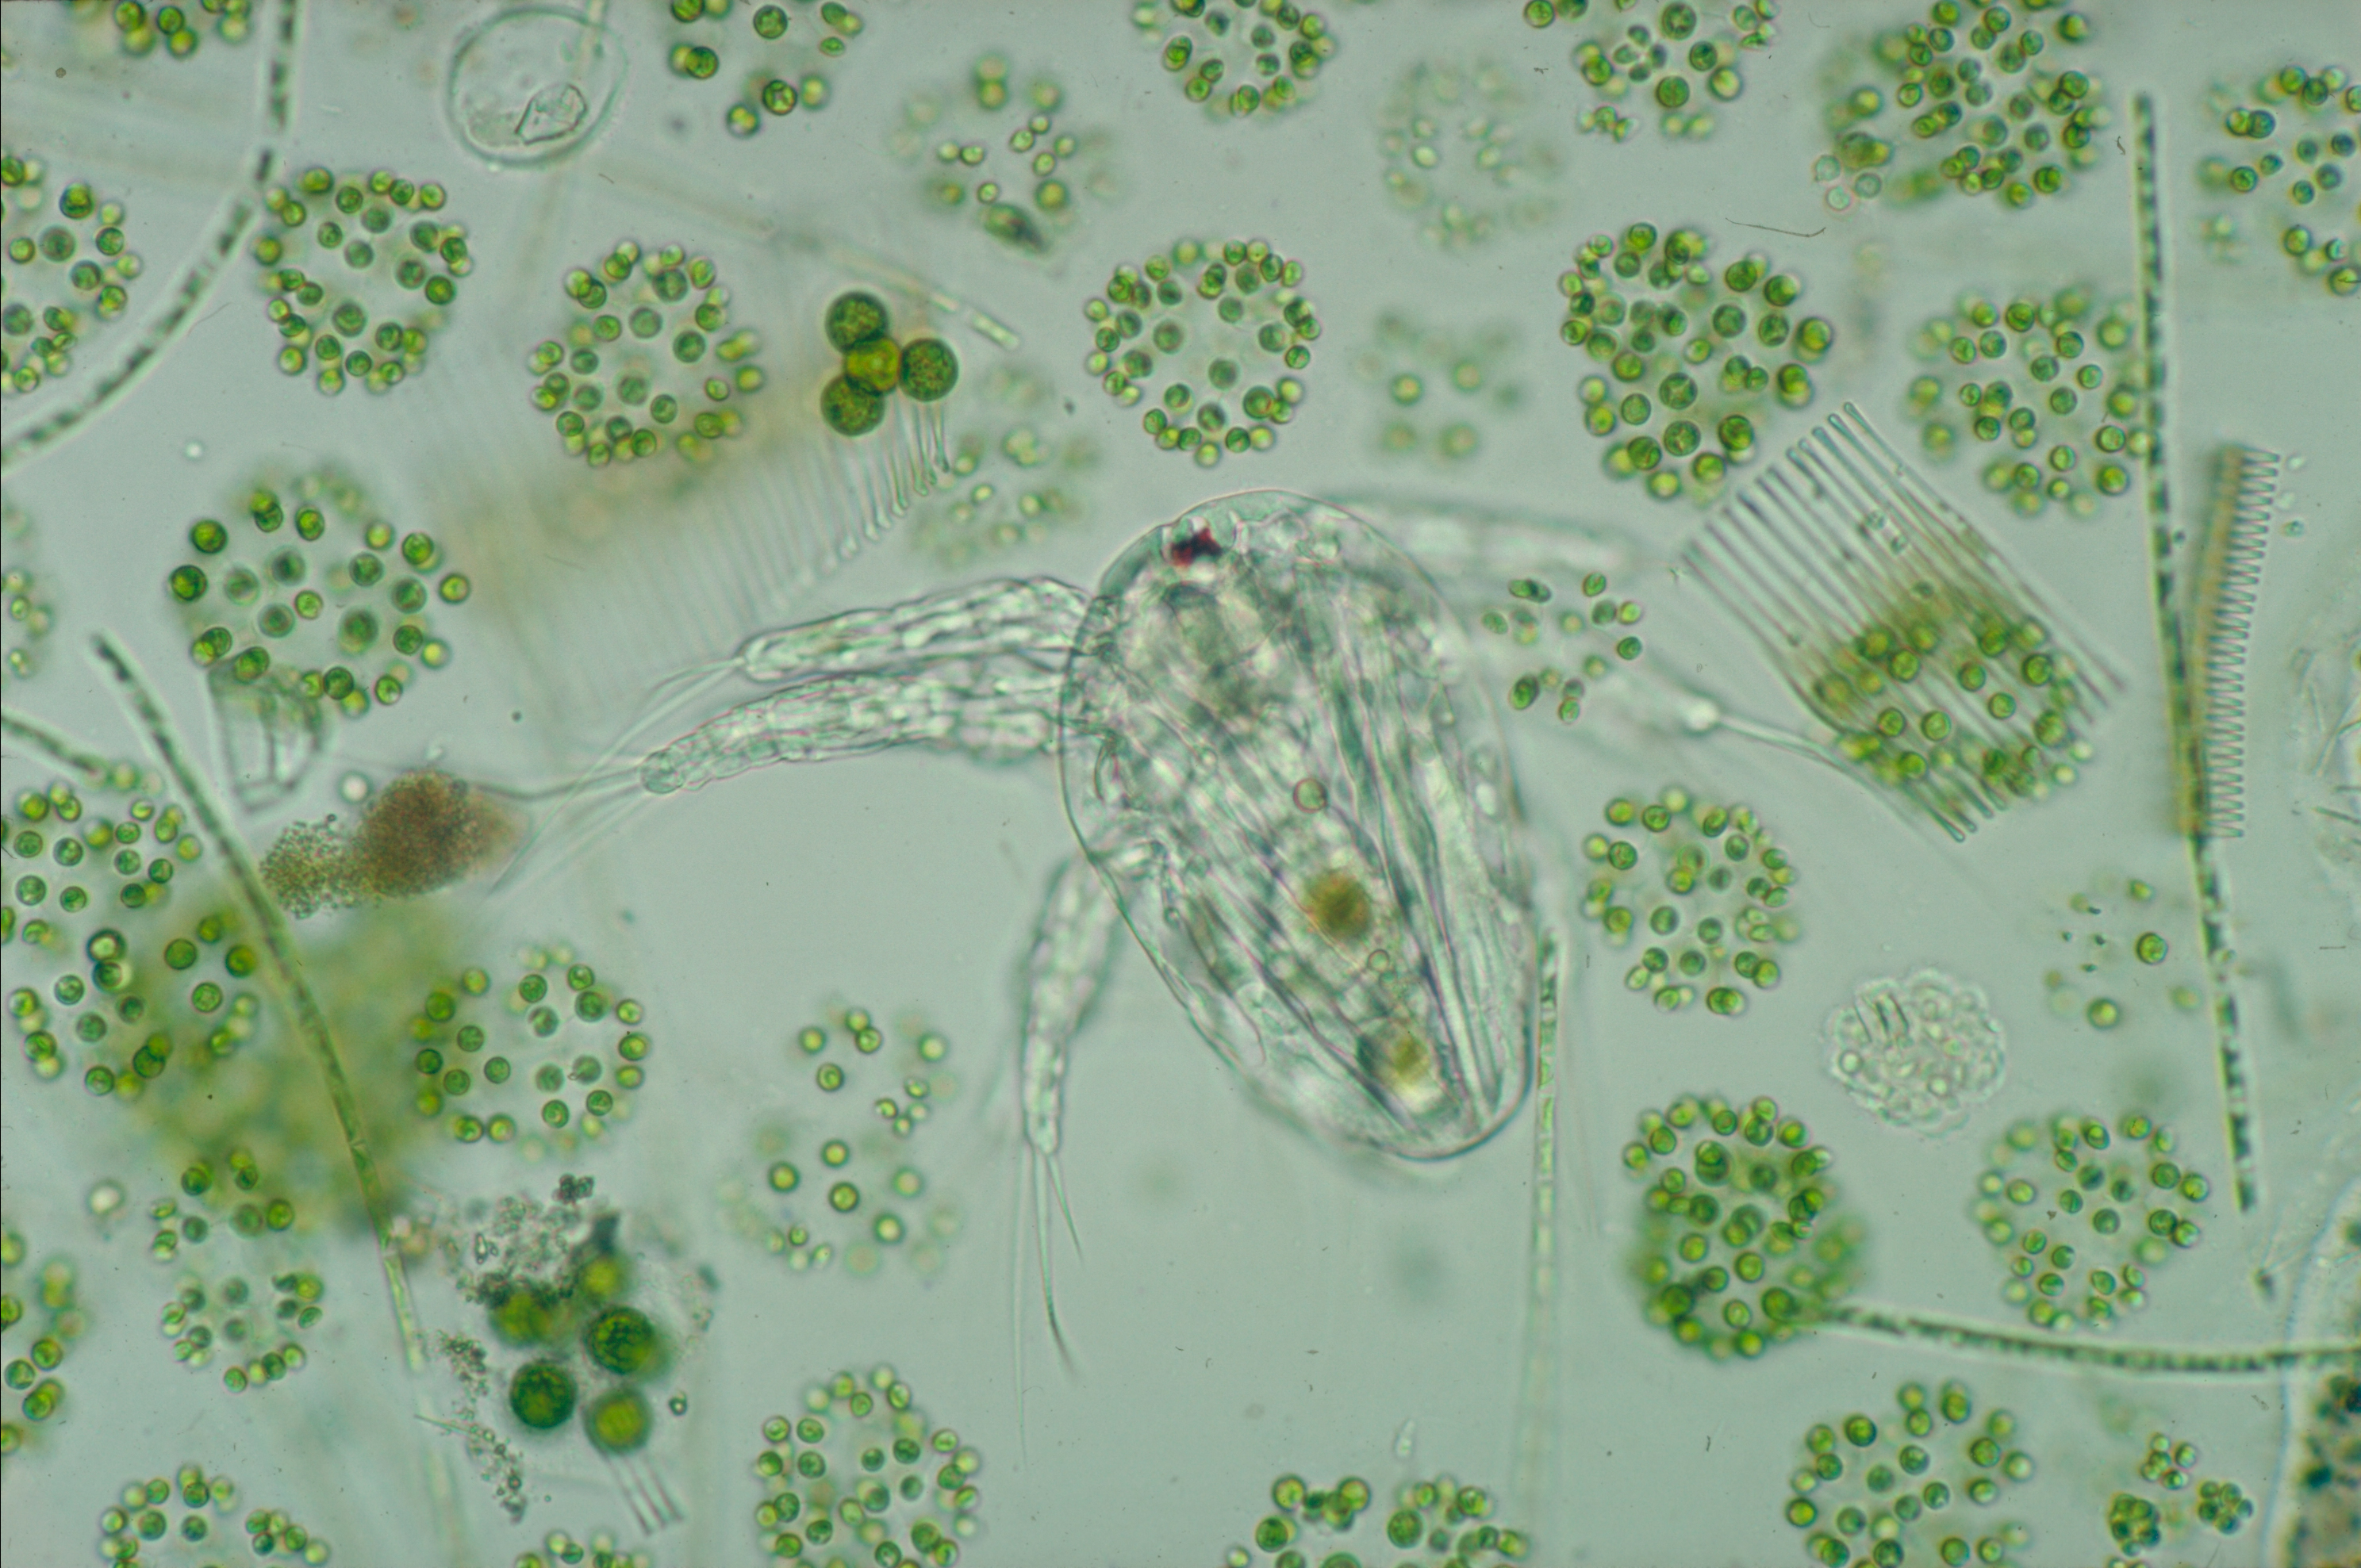
Freshwater plankton communities consist mainly of single-cell and colonial algae. Photo credit: Francesco Pomati, EAWAG.
To my knowledge you are the innovators in this area. Or do you know of other examples of music and data merging to create new meanings?
Other researchers already translated into music some of their data and results. As far as I know, however, most of these attempts focused more on music than on science. This means that researchers aimed at obtaining “pleasant” music, with canonical structure and catchy melody. To do that, one needs to modify real data quite a lot.
Interestingly, we did not know about any similar work of when we came up with the idea of translating plankton monitoring data into music. So maybe you are right and we are kind of innovators, because our music reflects real data and sounds as chaotic as natural communities can be. And I like it anyway!
What in your opinion is the role of music in communicating science?
I think music has a great potential, but is largely underexploited. Music evokes emotions in everyone, that means both scientific and non-scientific audience. There are countless ways to use music in science communication! Music is really ductile, but perhaps it’s not utilized to its full potential because people are less flexible.
I think scientists and science communicators just need to be open and creative. Music represents a common language for so many people, so let’s take advantage of this!
 Simone Fontana is a biologist interested in biodiversity and community ecology. In his free time, he is a passionate writer and musician.
Dr Simone Fontana’s Research Gate profile
Album “Mai Chiuso (1) Occhio” on CDBaby or Spotify
Album “SperiMentiamo… Il Vespro e L’Alba” on CDBaby or Spotify
 Francesco Pomati is a biologist that studies drivers and mechanisms in plankton community ecology across scales. He is also an active musician and guitarist.
Dr Francesco Pomati’s Phytoplankton Ecology group at EAWAG
The rock part band Monday Motion
- A handful of podcast recommendations from the Crastina crew - September 12, 2020
- A handful of podcast recommendations from the Crastina crew - August 8, 2020
- Dr Marek Skupinski – visual artist and scientific illustrator - May 6, 2020
- Let’s have a productive conversation about GMO – but first, stop saying “GMO”! - September 23, 2019
- The song of plankton – “visualizing” big data as music - April 9, 2018
- Darwin Day celebrated to promote public understanding of evolution - February 12, 2018
- Crastina Column, Sep–Oct 2017: Can a simple card game help us see things from ”the other’s” point of view? - September 19, 2017
- Talking science from the top of a soap box - February 13, 2017
- Science Gingerbread competition - December 13, 2016
- Dance your PhD – 2016 edition open for registration - September 14, 2016


Leave a Reply
Want to join the discussion?Feel free to contribute!