 https://crastina.se/wp-content/uploads/2013/08/useless_featured.png
806
851
Olle Bergman
Olle Bergman2013-08-13 14:10:102016-07-27 23:06:53Poor infographics adds to the communication noise
https://crastina.se/wp-content/uploads/2013/08/useless_featured.png
806
851
Olle Bergman
Olle Bergman2013-08-13 14:10:102016-07-27 23:06:53Poor infographics adds to the communication noise https://crastina.se/wp-content/uploads/2013/08/19119356.thb_.jpg
233
350
Olle Bergman
Olle Bergman2013-08-11 18:13:042016-07-27 23:12:02Search Engine Optimization for scientists
https://crastina.se/wp-content/uploads/2013/08/19119356.thb_.jpg
233
350
Olle Bergman
Olle Bergman2013-08-11 18:13:042016-07-27 23:12:02Search Engine Optimization for scientists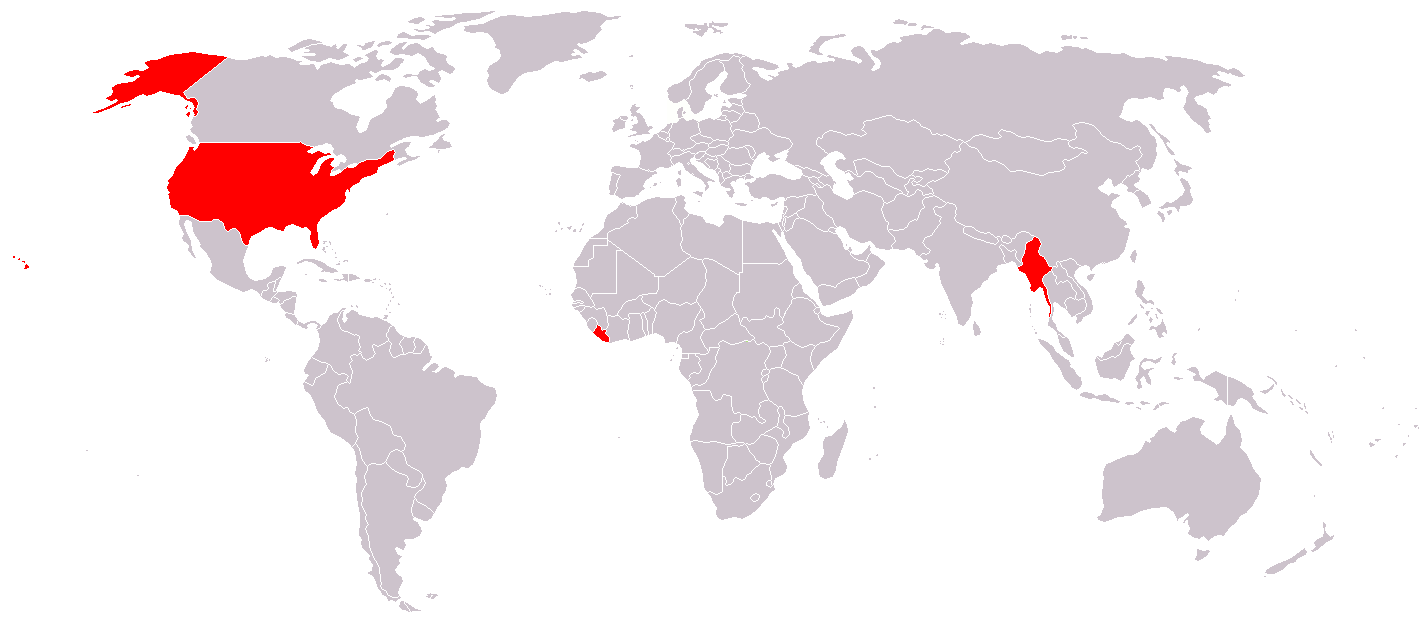 https://crastina.se/wp-content/uploads/2013/08/Metric_system.png
628
1427
Olle Bergman
Olle Bergman2013-08-08 11:39:202016-07-27 23:16:16Statistical maps tell us about our world
https://crastina.se/wp-content/uploads/2013/08/Metric_system.png
628
1427
Olle Bergman
Olle Bergman2013-08-08 11:39:202016-07-27 23:16:16Statistical maps tell us about our world